Market Technical Analysis 5.0.0
Free Version
Publisher Description
Trends, bullish bearish sentiment, support resistance from price and volume movements. Gaps, EMAs, RSI, ATR, ADX, MACD, Bollinger bands. US, Canadian, India, euro & Asia.
Stock market technical analysis in intraday, daily, weekly and monthly timeframes for stocks, ETFs and Indexes.
Trend analysis identifies the price movement trends using pivot points (peaks and troughs). It also gives price levels to watch out for trend reversals and changes in the future.
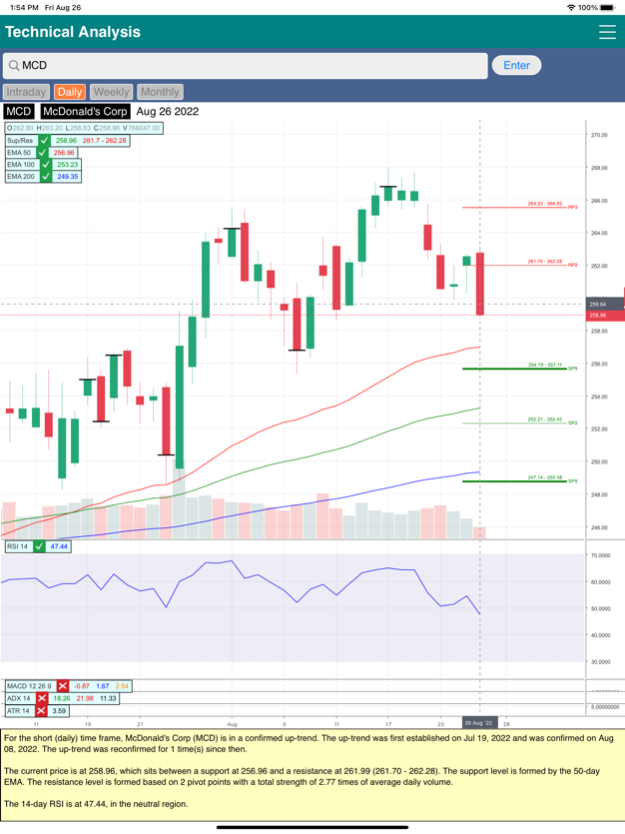
Support and resistance analysis identifies support resistance levels using moving averages, pivot points, pricing patterns and gaps. It also gives quantitative description of the support and resistance strength based on the analyzing of volumes and occurrences.
Up/down volume analysis identifies accumulation or distribution conditions using the A/D ratio.
Traditional technical analysis include RSI, MACD, ADX, Bollinger Bands and ATR indicators.
For RSI, it identifies overbought and oversold conditions in a range-bound (non-trending) market. In a trending market, it signals trend reversal by looking for divergences between the movements of pricing and the indicator.
For MACD, it describes bullish or bearish sentiment with pricing momentum and gives alerts of bullish and bearish crossover in the signal line.
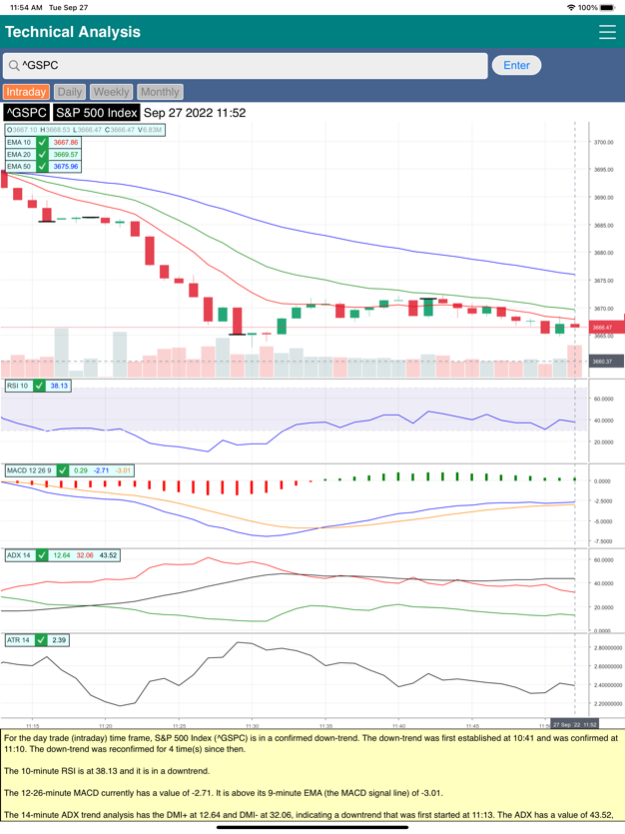
For the ADX indicator, it interprets trend strength and direction based on DMI+, DMI- and ADX lines.
Bollinger bands analyzer (new for version 5) interprets the current pricing positions against the bands. It also analyzes the %b value against historical volatility for the band to be in the squeeze or bulge conditions to identify the beginning or the end of a movement.
The ATR analysis indicates volatility of pricing changes to find profitable entry and exit levels of trades.
Candlestick analyzer finds candlestick patterns.
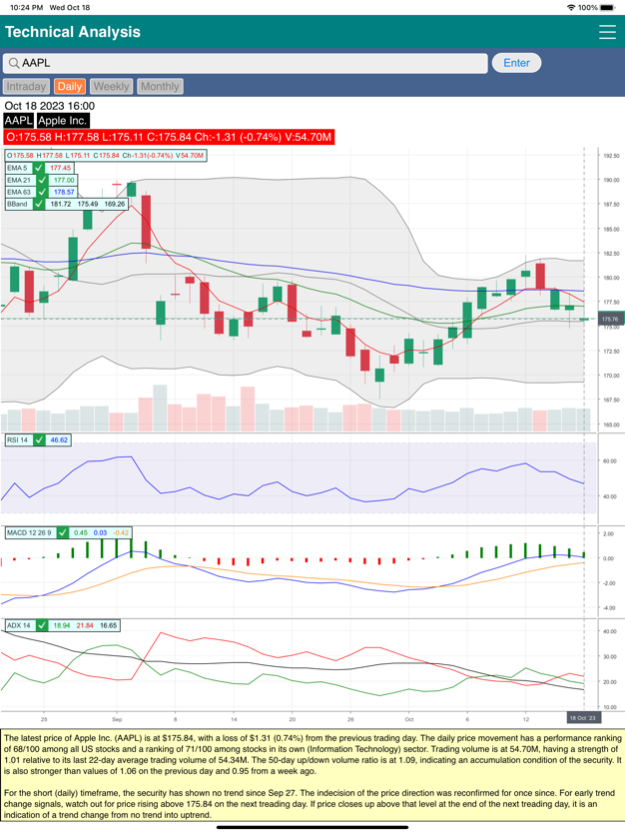
Daily summary analysis compares price performance of a security against the general market as well as other securities in its own industry. The volume strength measures the trading volume against its own recent average volume at the same time fraction during a trading day. High volume strength can be used to confirm price movements and low volume strength signals the lack of conviction of the changes.
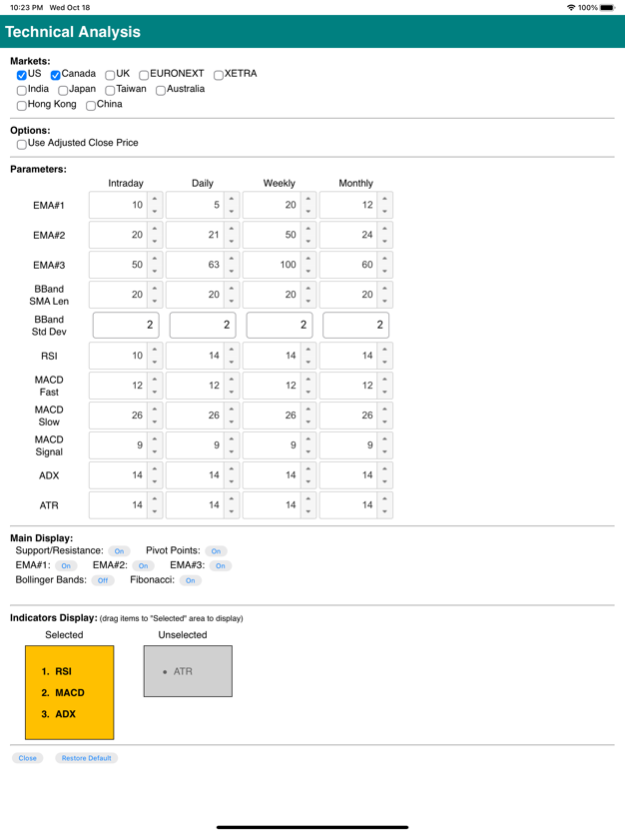
The parameters for moving averages and indicators are fully customizable for each timeframe.
Other than the USA and Canadian (TSX) markets, the app also supports UK (LSE), Europe (EURONEXT and XETRA), India (NSE), Japan (XTKS, XFKA and XSAP), Taiwan (XTAI and ROCO), Australia (ASX), Hong Kong (XHKG) and China (XSHE and XSHG) markets.
Version 4.5 and later include the option of using Adjusted Close Price. Adjusted close is the closing price after adjustments for all applicable splits and dividend distributions. Data is adjusted using appropriate split and dividend multipliers, adhering to Center for Research in Security Prices (CRSP) standards.
Oct 19, 2023
Version 5.0.0
Add Bollinger Bands indicators and analyzer.
Add daily price gain strength and volume strength analysis (for daily time frame only).
Add Up/Down volume analysis.
Add candlestick pattern analysis.
Improved trend analysis with price levels for early lookout of trend changes.
Include options to turn on/off pivot points and Fibonacci lines on the main chart.
About Market Technical Analysis
Market Technical Analysis is a free app for iOS published in the Accounting & Finance list of apps, part of Business.
The company that develops Market Technical Analysis is George Kung. The latest version released by its developer is 5.0.0.
To install Market Technical Analysis on your iOS device, just click the green Continue To App button above to start the installation process. The app is listed on our website since 2023-10-19 and was downloaded 2 times. We have already checked if the download link is safe, however for your own protection we recommend that you scan the downloaded app with your antivirus. Your antivirus may detect the Market Technical Analysis as malware if the download link is broken.
How to install Market Technical Analysis on your iOS device:
- Click on the Continue To App button on our website. This will redirect you to the App Store.
- Once the Market Technical Analysis is shown in the iTunes listing of your iOS device, you can start its download and installation. Tap on the GET button to the right of the app to start downloading it.
- If you are not logged-in the iOS appstore app, you'll be prompted for your your Apple ID and/or password.
- After Market Technical Analysis is downloaded, you'll see an INSTALL button to the right. Tap on it to start the actual installation of the iOS app.
- Once installation is finished you can tap on the OPEN button to start it. Its icon will also be added to your device home screen.
